Business Dashboard: Data & Recent Activity
In This Article:
Important: The Dashboard might not show what is reflected below if you are not the Account Owner. Instead, you will see your Total Clients, Subscriptions, One-time invoices, and Projected Monthly income.
Data & Analytics
Your Dashboard gives you at-a-glance view of all of your business analytics on AdvicePay. We've also included projections, so you know what to expect for the rest of the month or next month!
At the top you can quickly view:
- Total Clients - registered + unregistered
- Total Advisors - total registered + unregistered
- Monthly Documents - total pending + signed
- Projected monthly income - total estimated + received for the upcoming month
Tip: all Dashboard revenue figures reflect gross amounts (before fees are taken out), while your Transfers page reflects net amounts (after fees are taken out)!
In the graph section you can toggle between different date ranges to see larger trends, as well as select alternative views (total revenue vs. subscriptions vs. one-time invoices) to drill down on select data.

Understanding the Numbers
Here is a quick orientation to your dashboard data!
Date view options are:
- MTD - month to date
- QTD - quarter to date
- YTD (default) - year to date
- All

As the date range view changes, the Gross revenue, Current Period vs Last, and Monthly Average (if applicable) data points in your table change so that you can see data for the selected dates.
For example, if you select MTD the Gross revenue figure will tell you your total received revenue for the current month so far. When YTD is selected, you will see your total received revenue from January of the current year to present.
Total Revenue graph view
By default the revenue graph displays both your gross subscriptions and gross one-time invoices vs. the average received. At the top you'll see the total gross revenue for that month:

By hovering your cursor over the current month you will see both your total Gross Revenue received so far (by placing your cursor over the dark blue area of the graph) and your Estimated Revenue (by hovering over the light gray area of the graph):

For past months you will see only Total Revenue received, and for the upcoming month, you will see only Estimated Revenue.
Narrowing data to Subscriptions or One-time Invoices only

The Subscription and One-time Invoices view show the same information as the Total Revenue tab, but limit it to subscription data only or one-time invoice data only.
One-time Invoices Example View:

Estimated Revenue
When hovering over the next month, you'll see the gray bar (no blue bar).
This is the estimated revenue for the following month based on your current and ongoing subscriptions, as well as upfront, and one-time payments scheduled to be billed in that next month's time frame. Anything due to be billed with a bill date in the next month will show on the expected revenue.
In addition, estimated revenue can also be broken down into one-time payments and subscriptions.
Here's an example of the expected revenue for April:

Hint: If a subscription has not completed billing in the current month, it will not show in the estimate for the next month until after it has been billed for the current revenue month. Thereafter, when the new bill date is set for the expected revenue month, it will then show in there.
Recent Activity Notifications
Gain a clearer picture of what's happening with clients and their payments by viewing your account's Recent Activity below your dashboard graph!
We'll display a notification when:
- A new client registers their account
- A subscription is authorized or "started" by the client
- An invoice payment is pending (e.g. processing)
- An invoice is paid
- An invoice is past due
- An invoice payment fails
- An invoice is disputed
- A subscription with set billing periods is ending soon
- A subscription with set billing periods has completed
- A client cancels their subscription
- A payout transfer was made to your account

To view more activity on the account, scroll to the bottom and click See more activities. This page includes activity notifications for the last 10 days.
To filter notifications by type, click the drop down menu in the upper right and select All, Clients, Subscriptions, or Invoices and more.
Available Integrations
Hint: If you are not logging into AdvicePay directly and instead use a CRM, some of the integrations might not connect since they do require direct access to AdvicePay. for the integration.
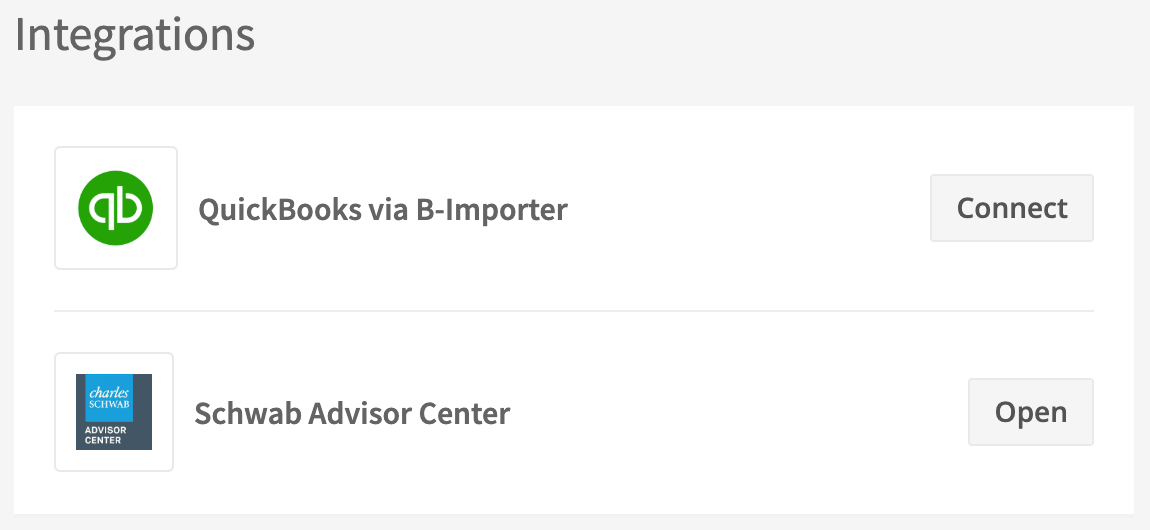
All of AdvicePay's available integrations will show up in the Integrations section at the bottom of the Dashboard! If you use the services listed there and are interested in an integration, simply click the button next to the service to get started:

Frequently Asked Questions
I don't see a recent invoice that was created/paid reflected on my graph -- where is it?
We cache your data to keep it speedy! 🏎To see recently updated information, click the refresh icon in the bottom left-hand corner of the graph:

Do the revenue amounts reflect fees before or after transaction fees are deducted?
Amounts reflect gross revenue, so they are calculated before fees are taken out. A breakdown of fees can be found on your Transfers screen and Transaction report.
